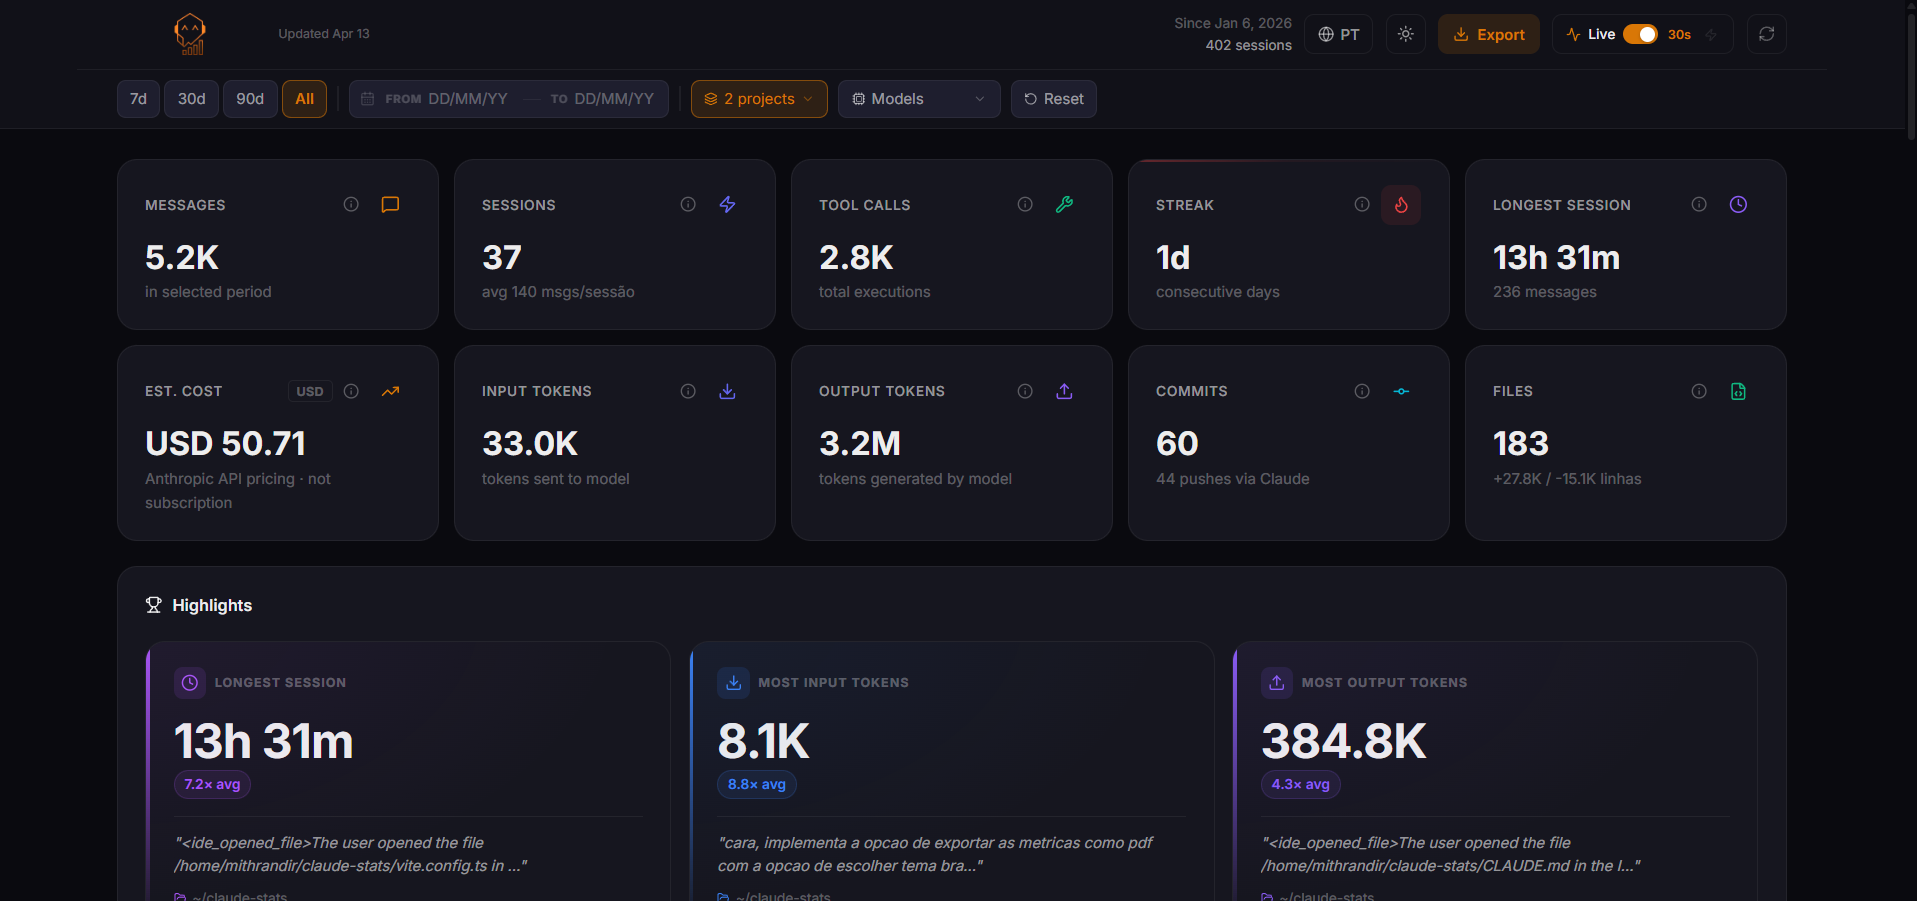
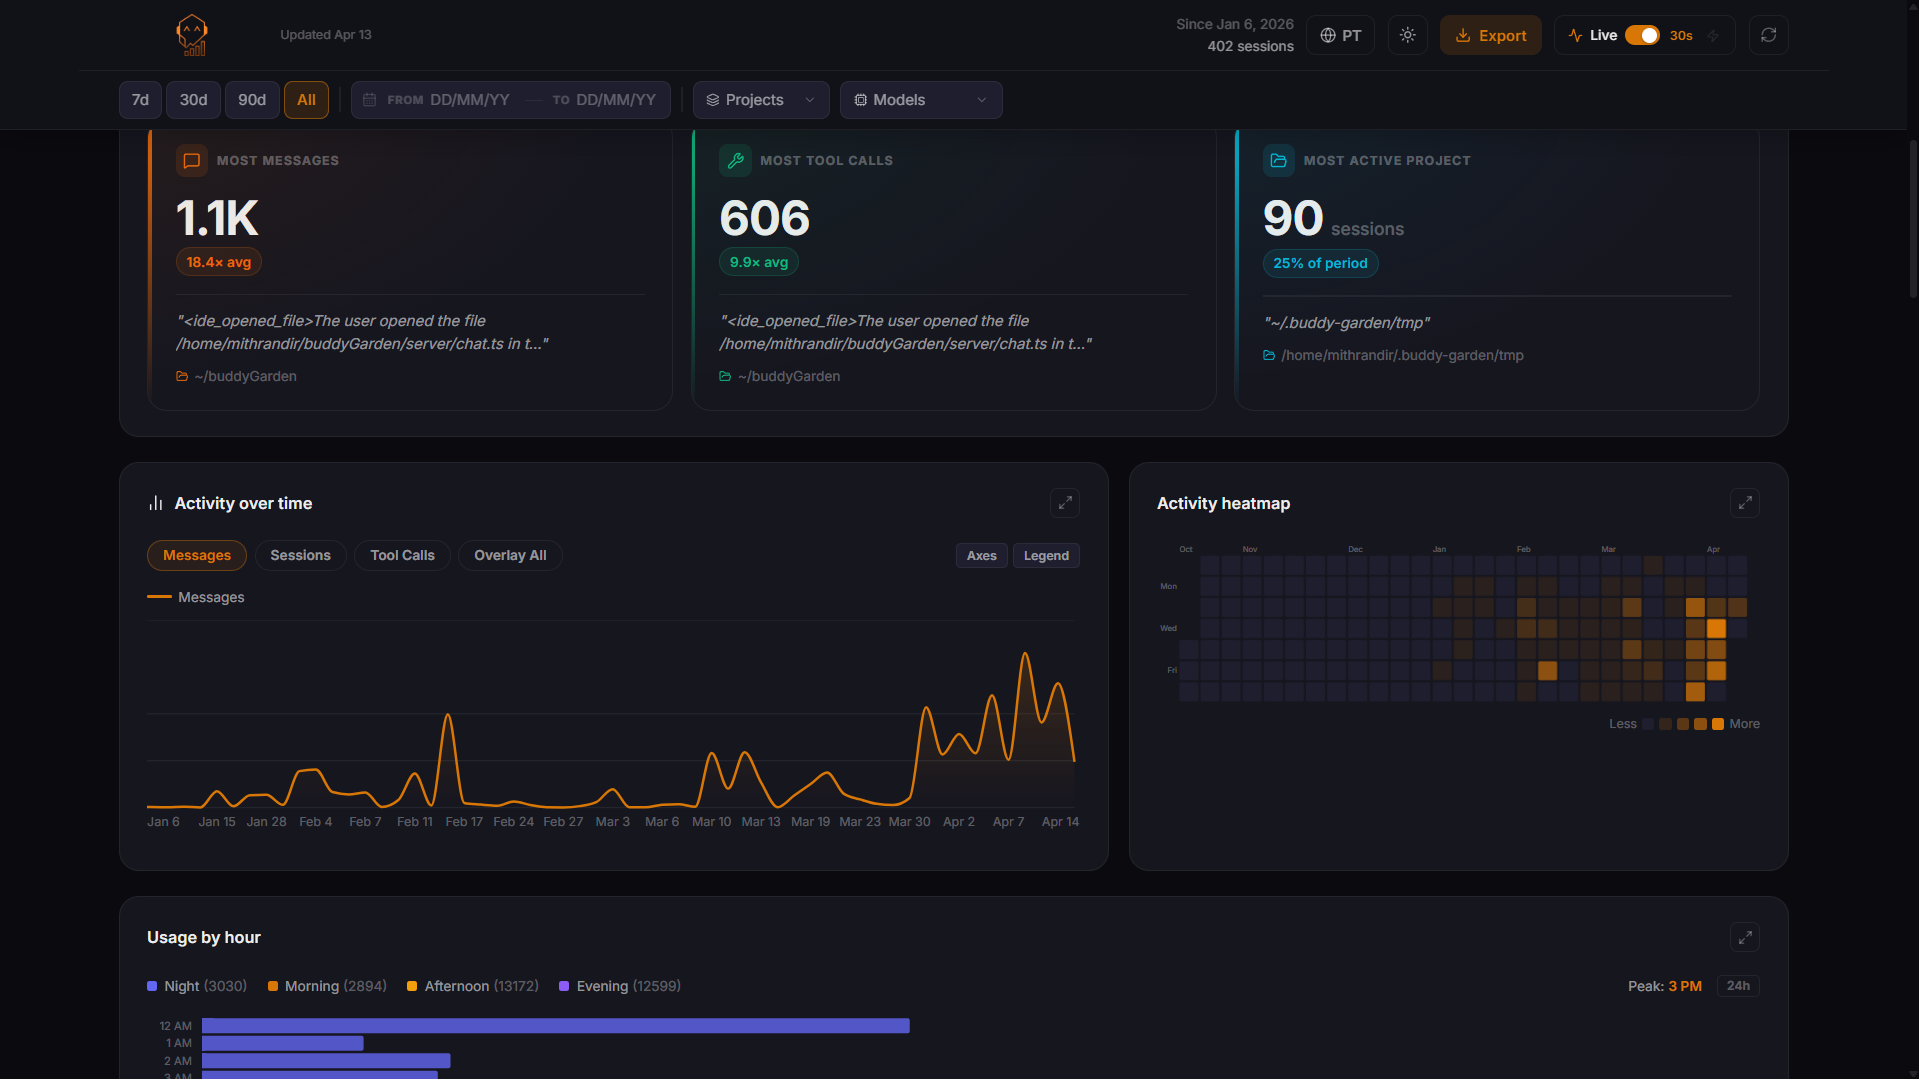
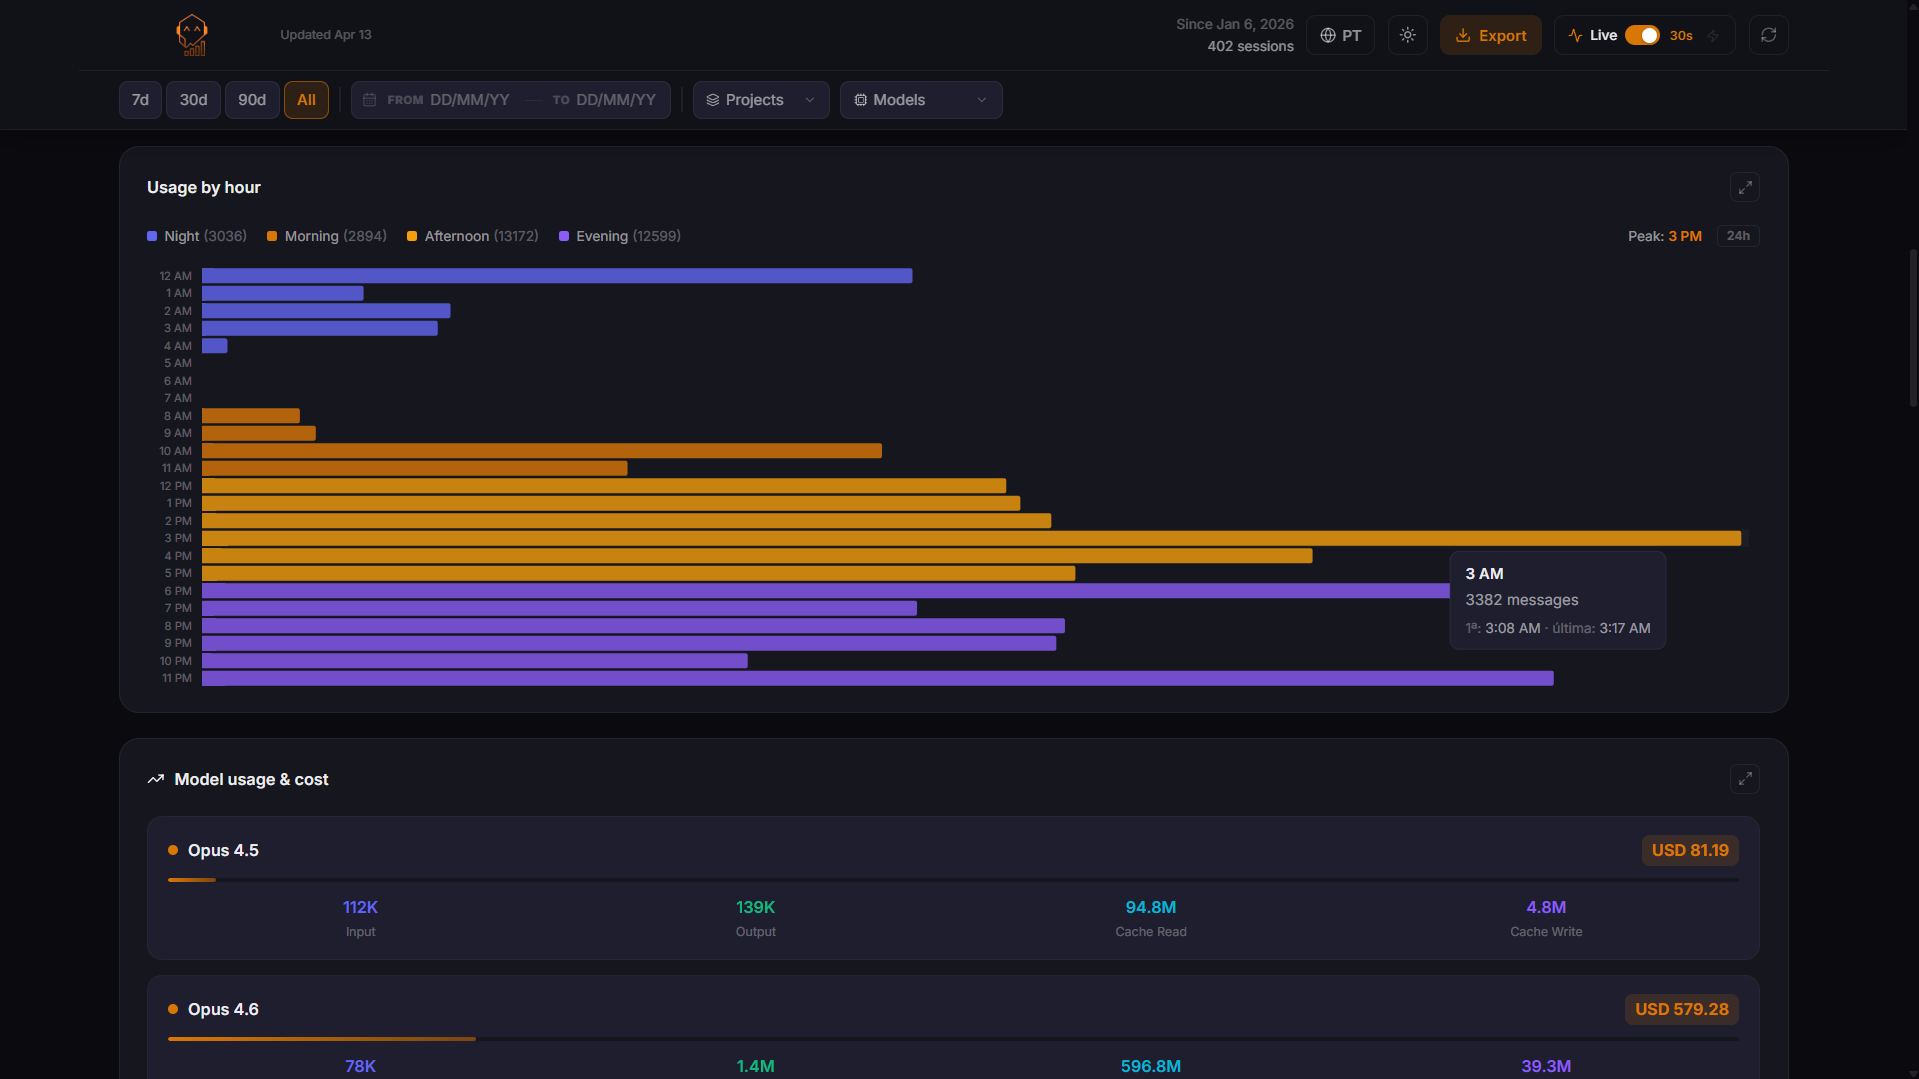
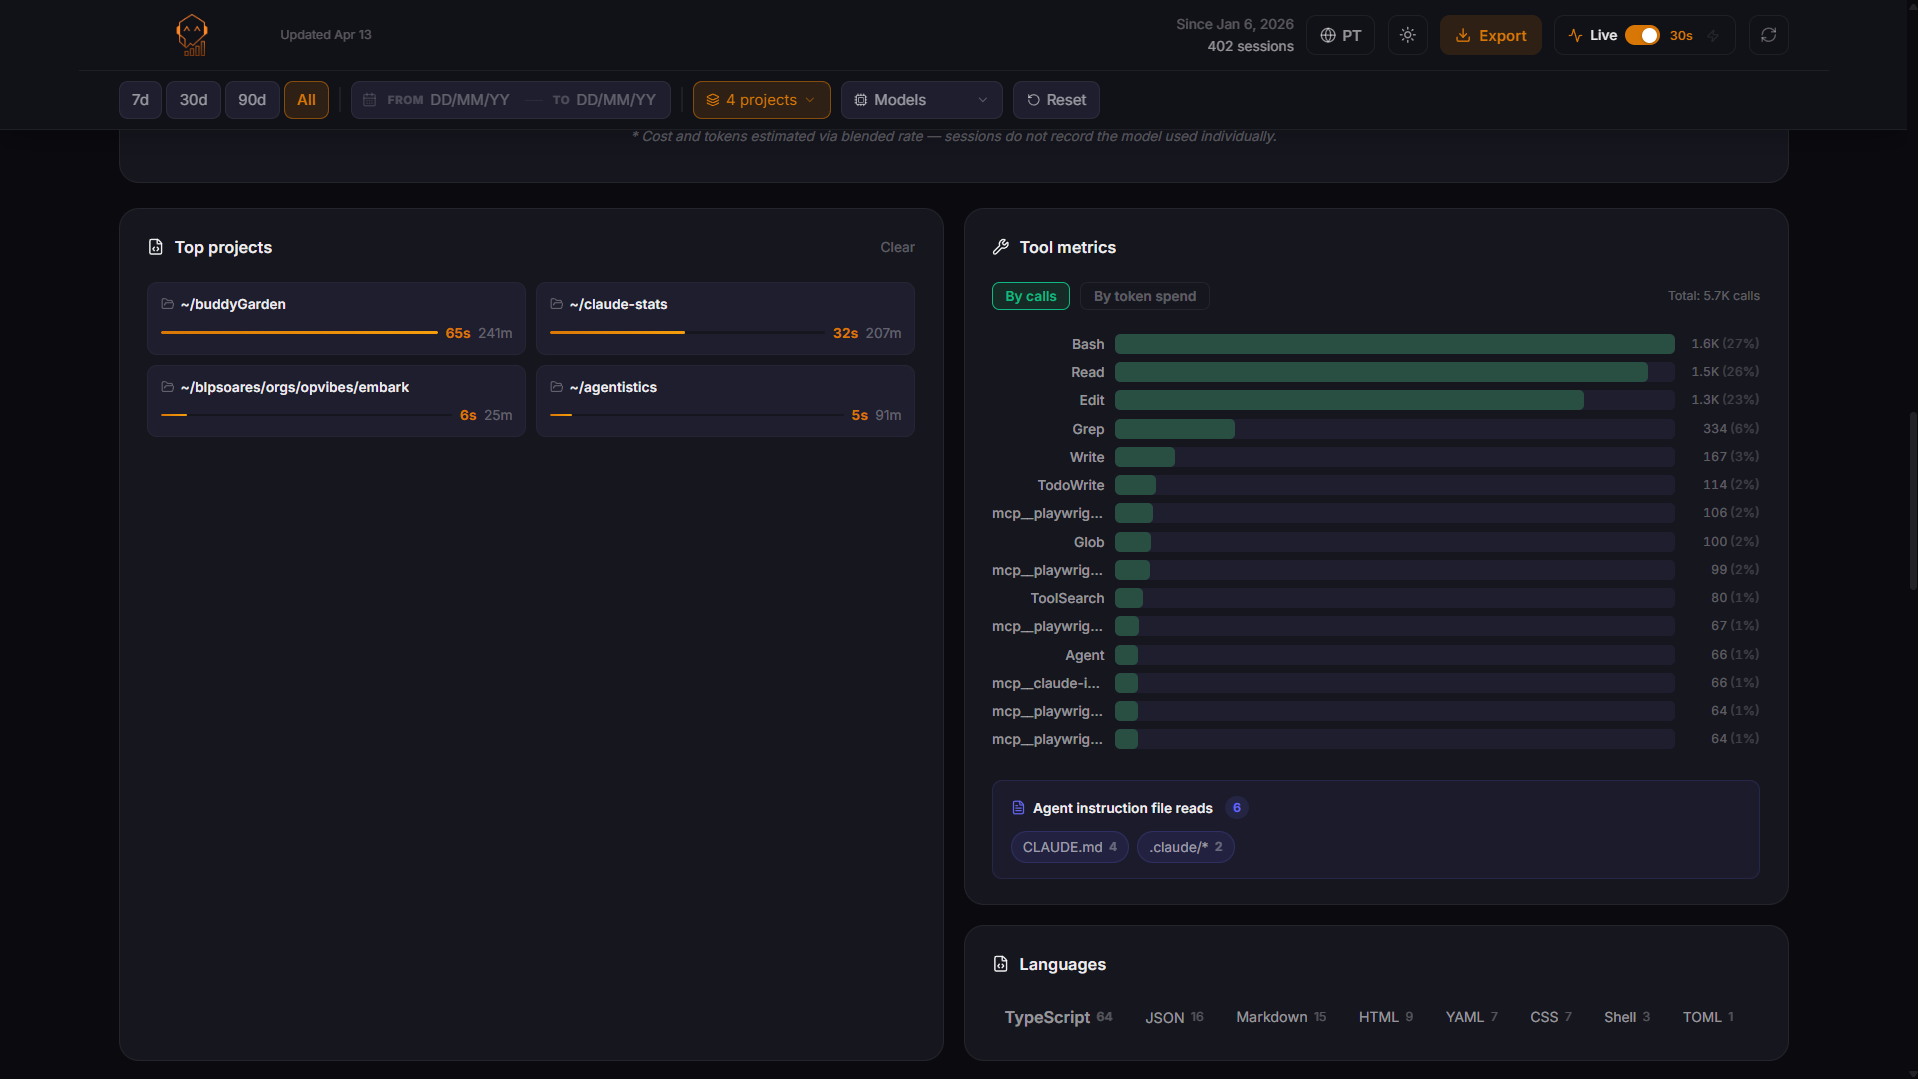
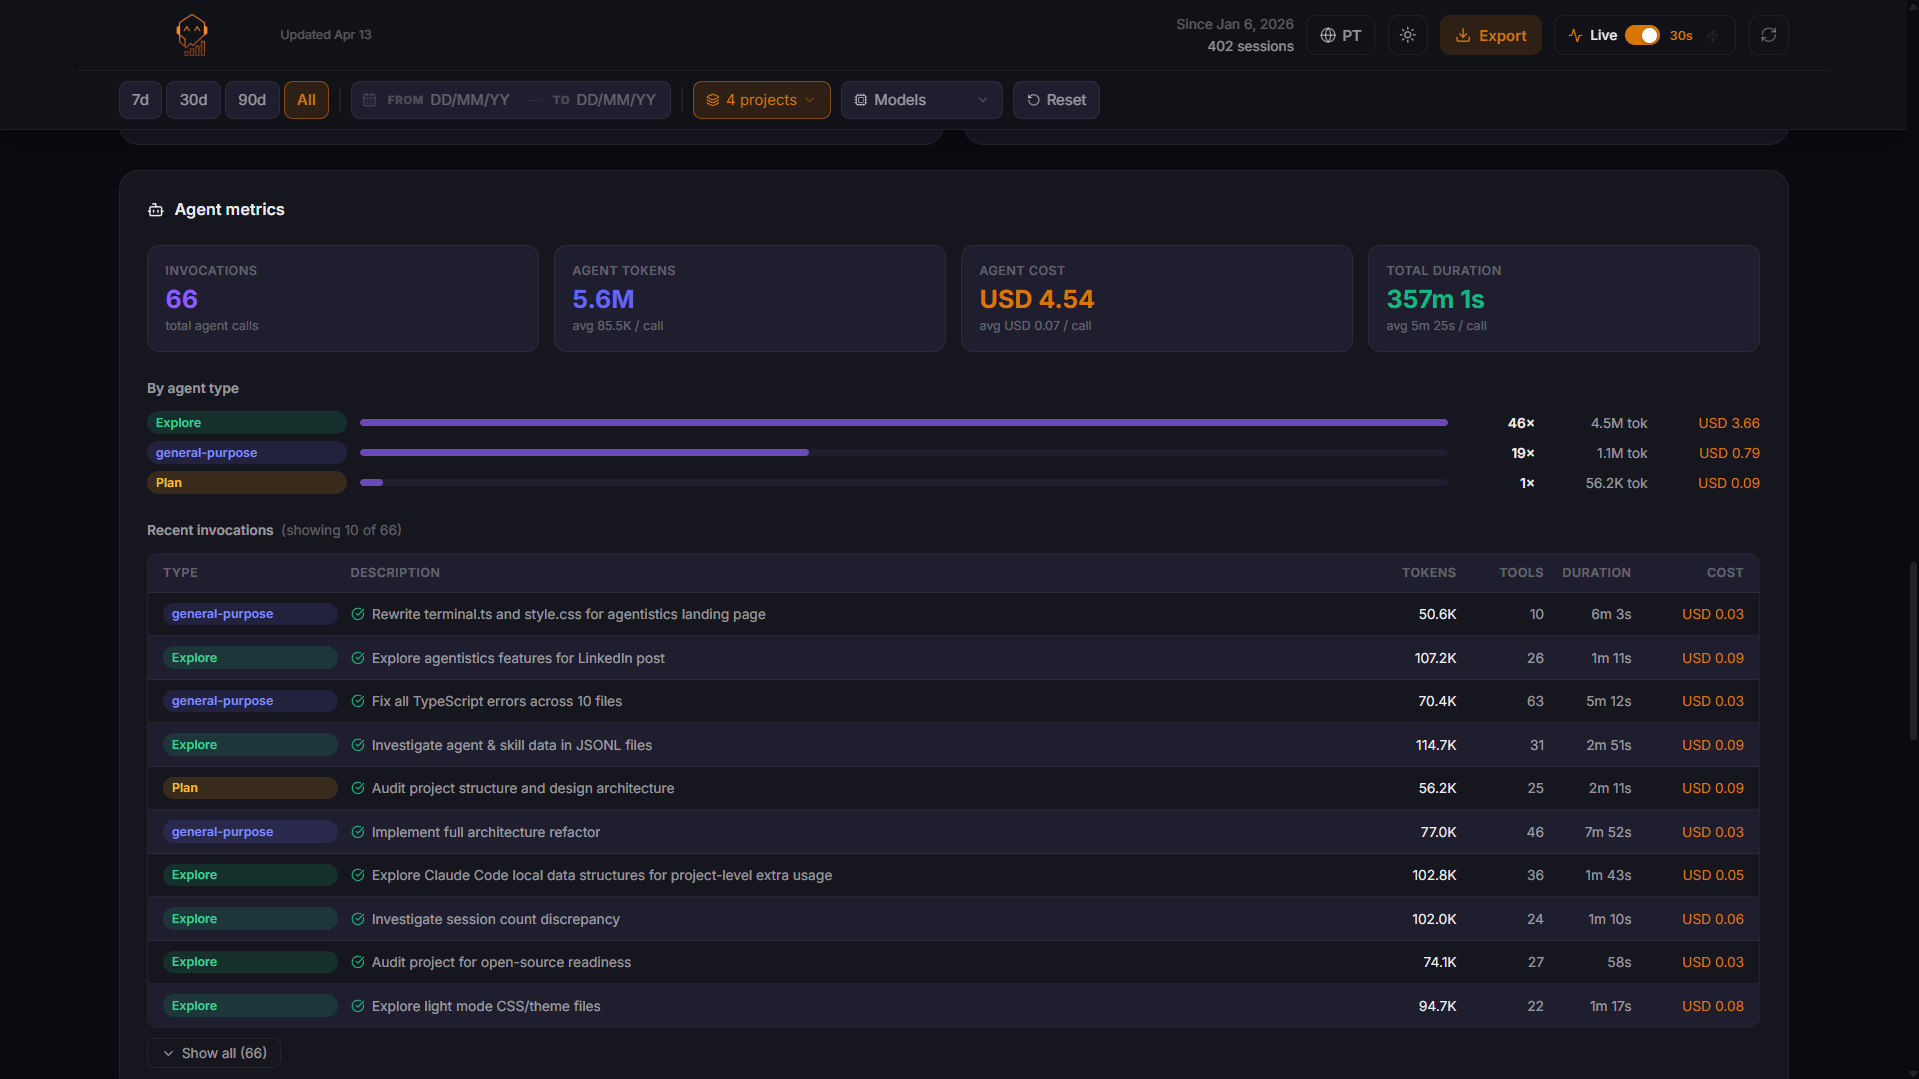
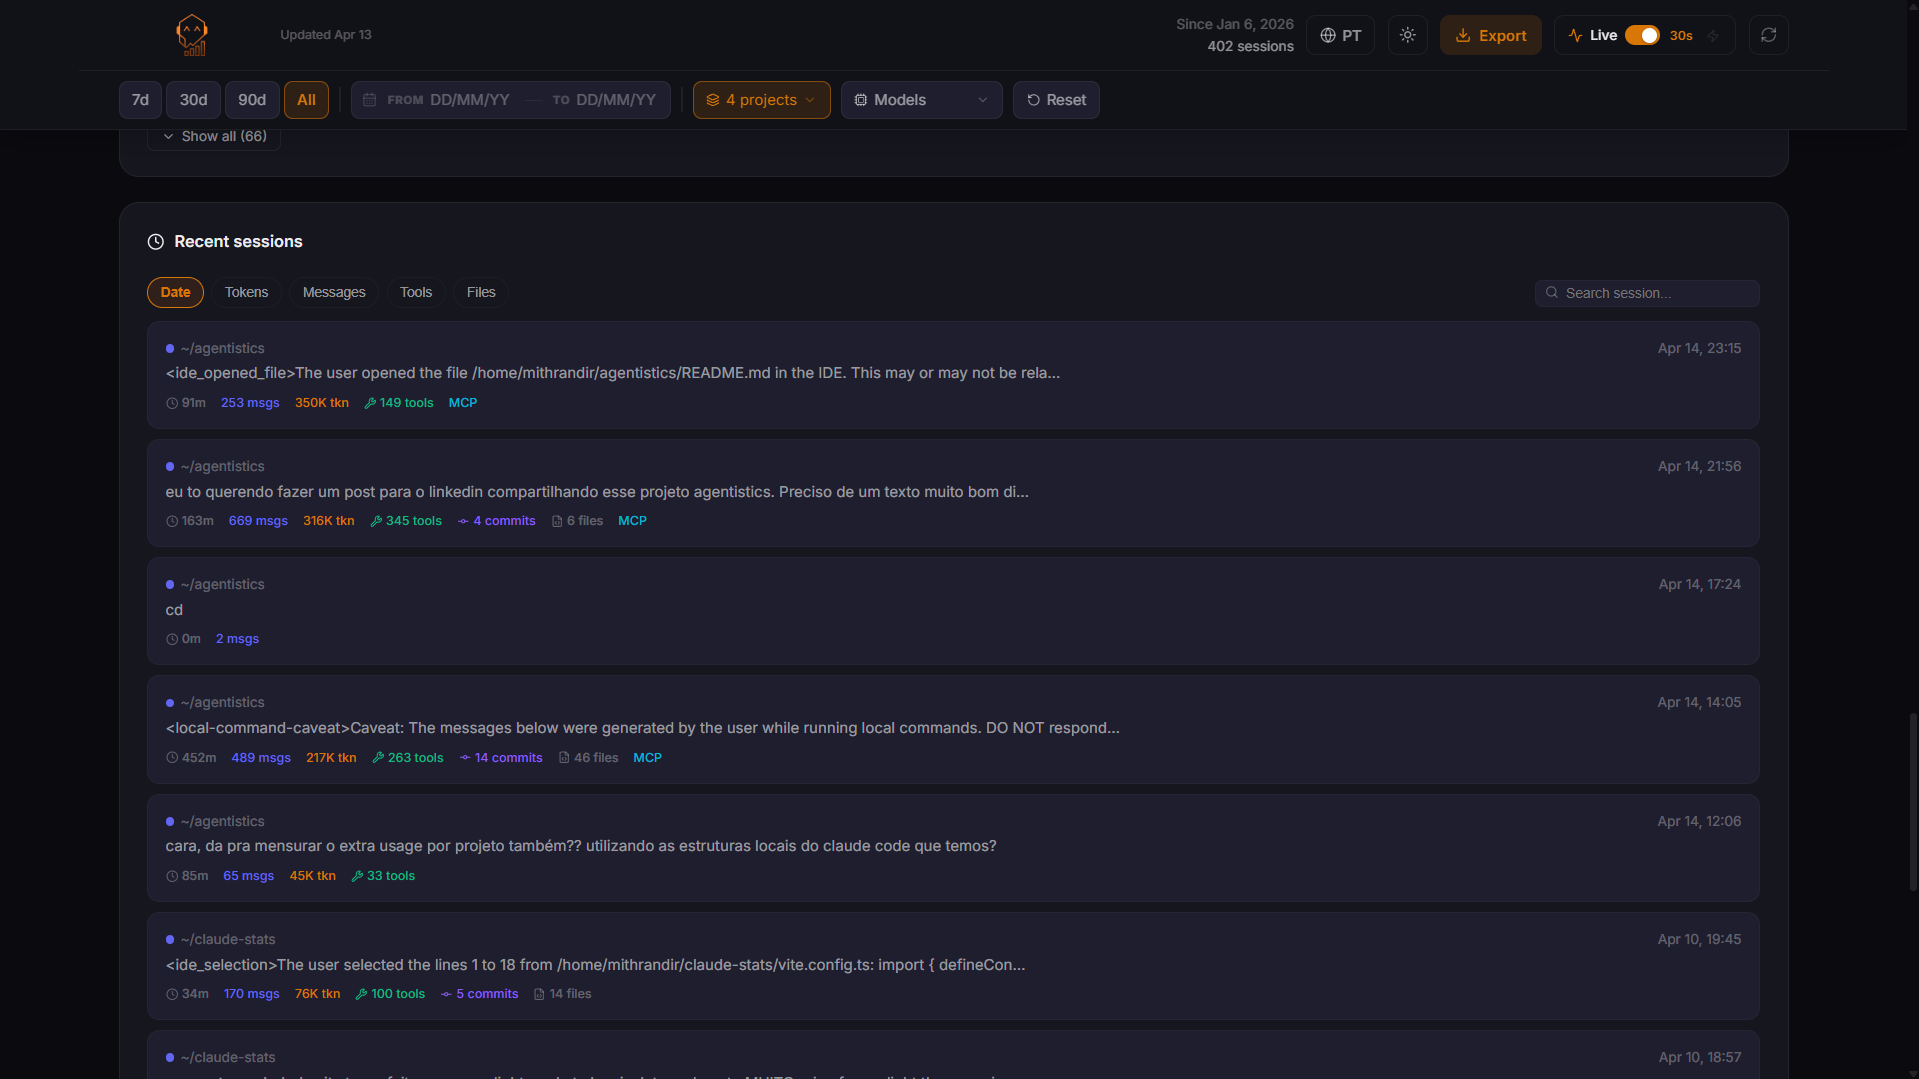
local-first · zero cloud · open source

Every token
counts.

Local analytics dashboard for AI coding assistants.
Tokens, costs, agent metrics and activity heatmap —
parsed straight from ~/.claude/

0 tokens today
$0.00 total cost
0 sessions
0d
streak

Every metric.
One interface.

Real screenshots from a live agentistics instance.
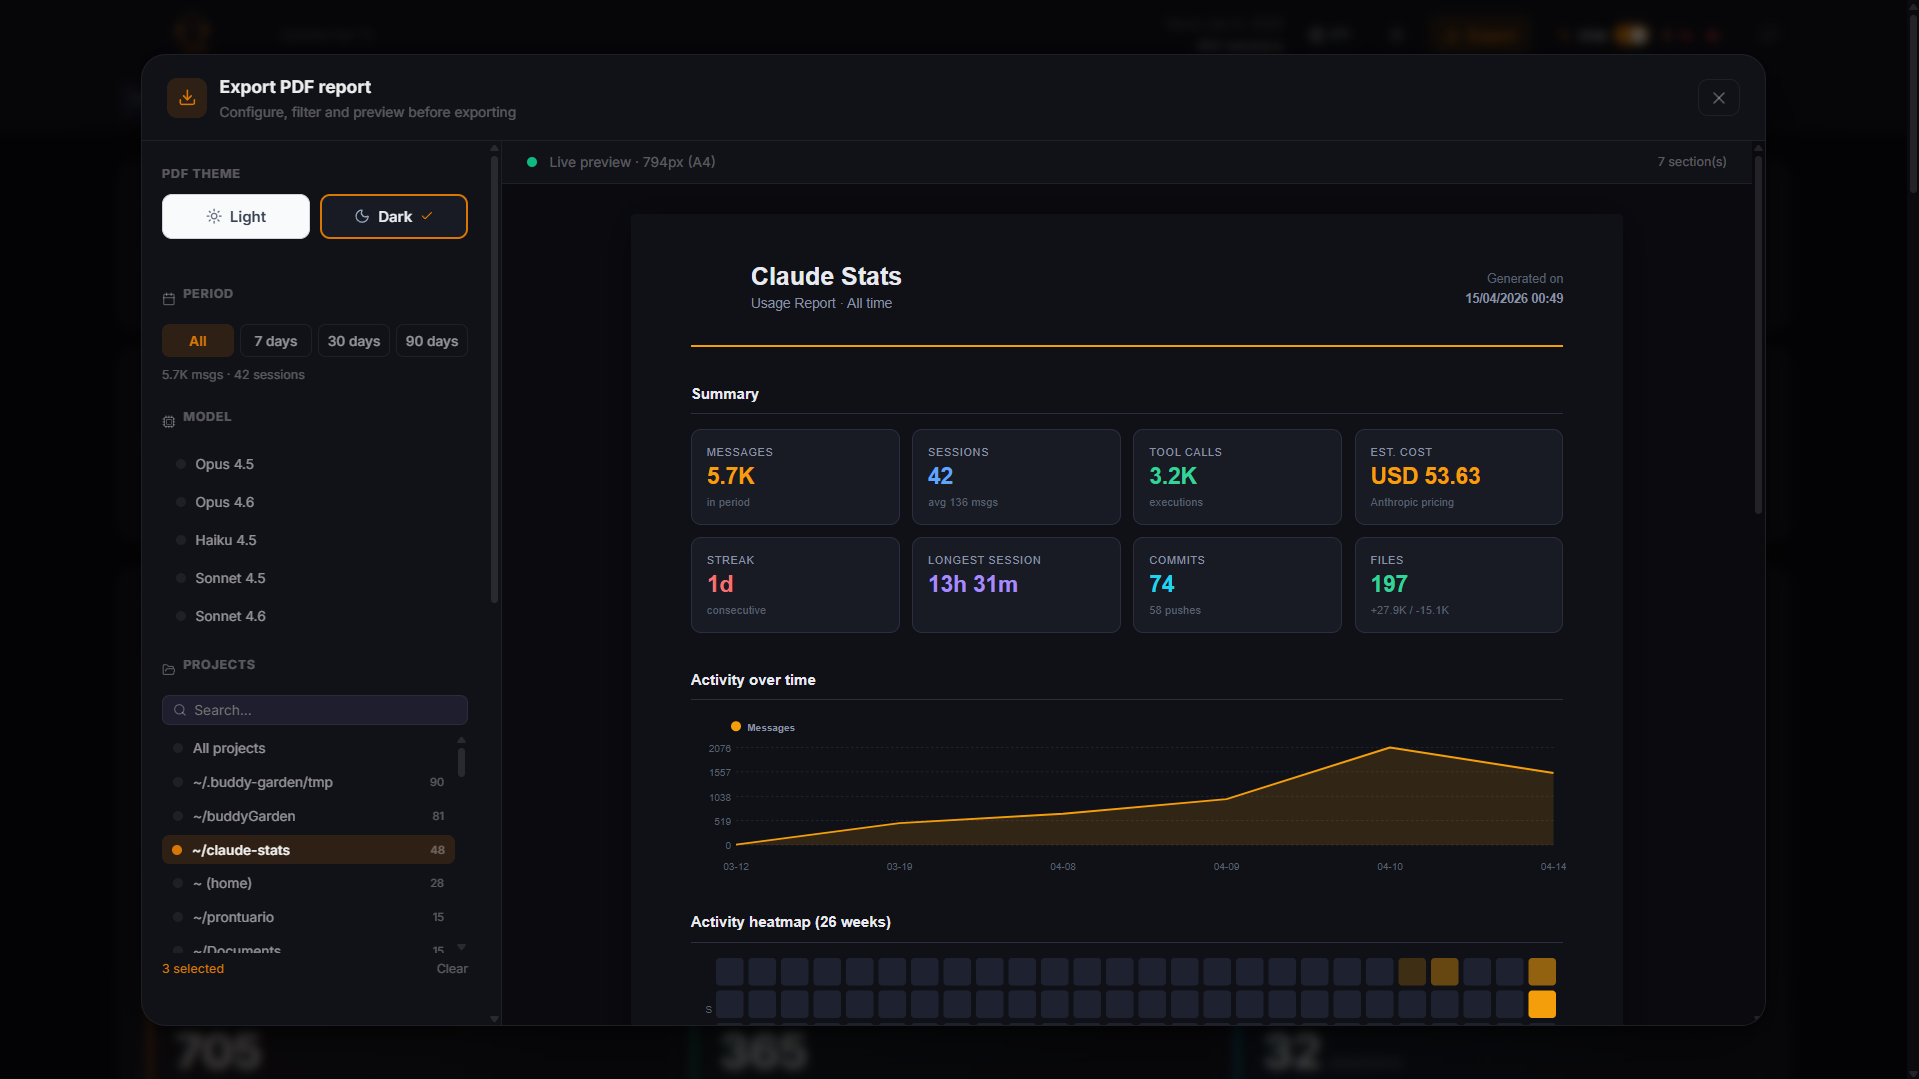
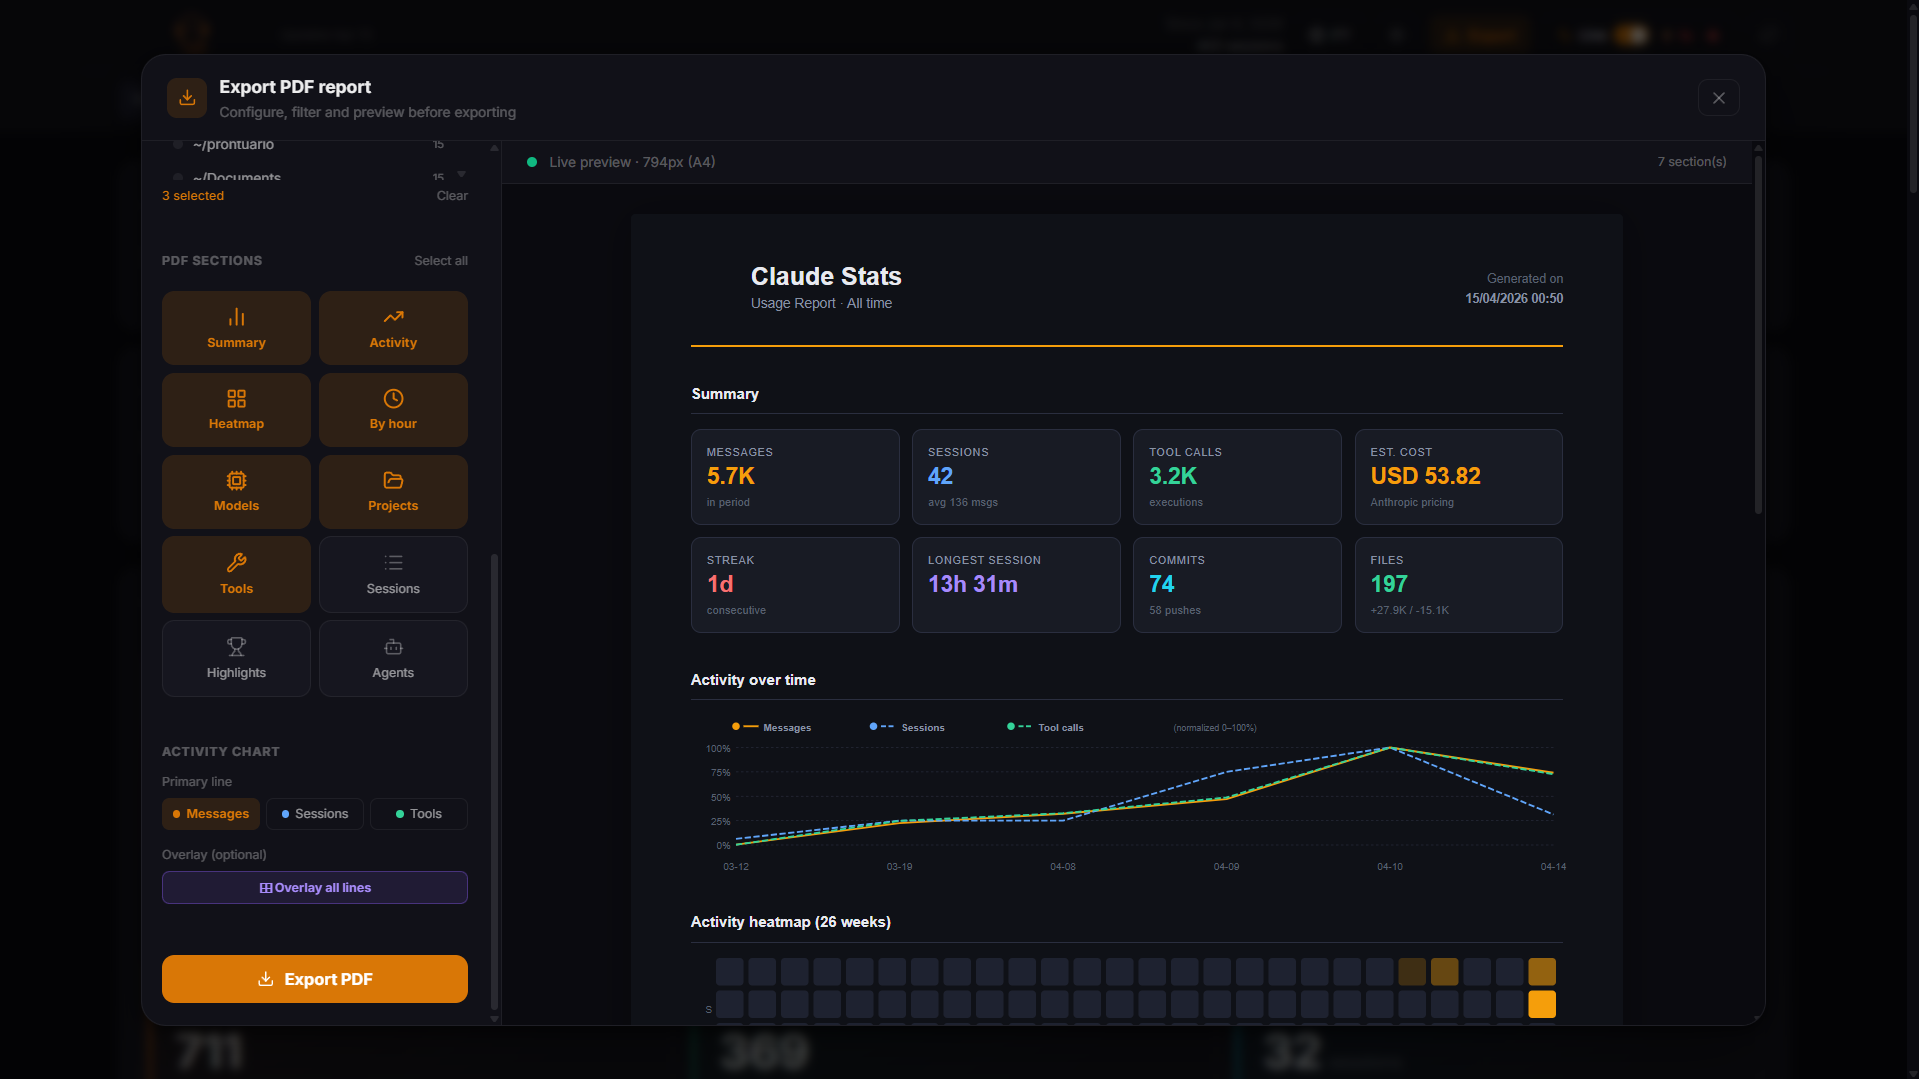
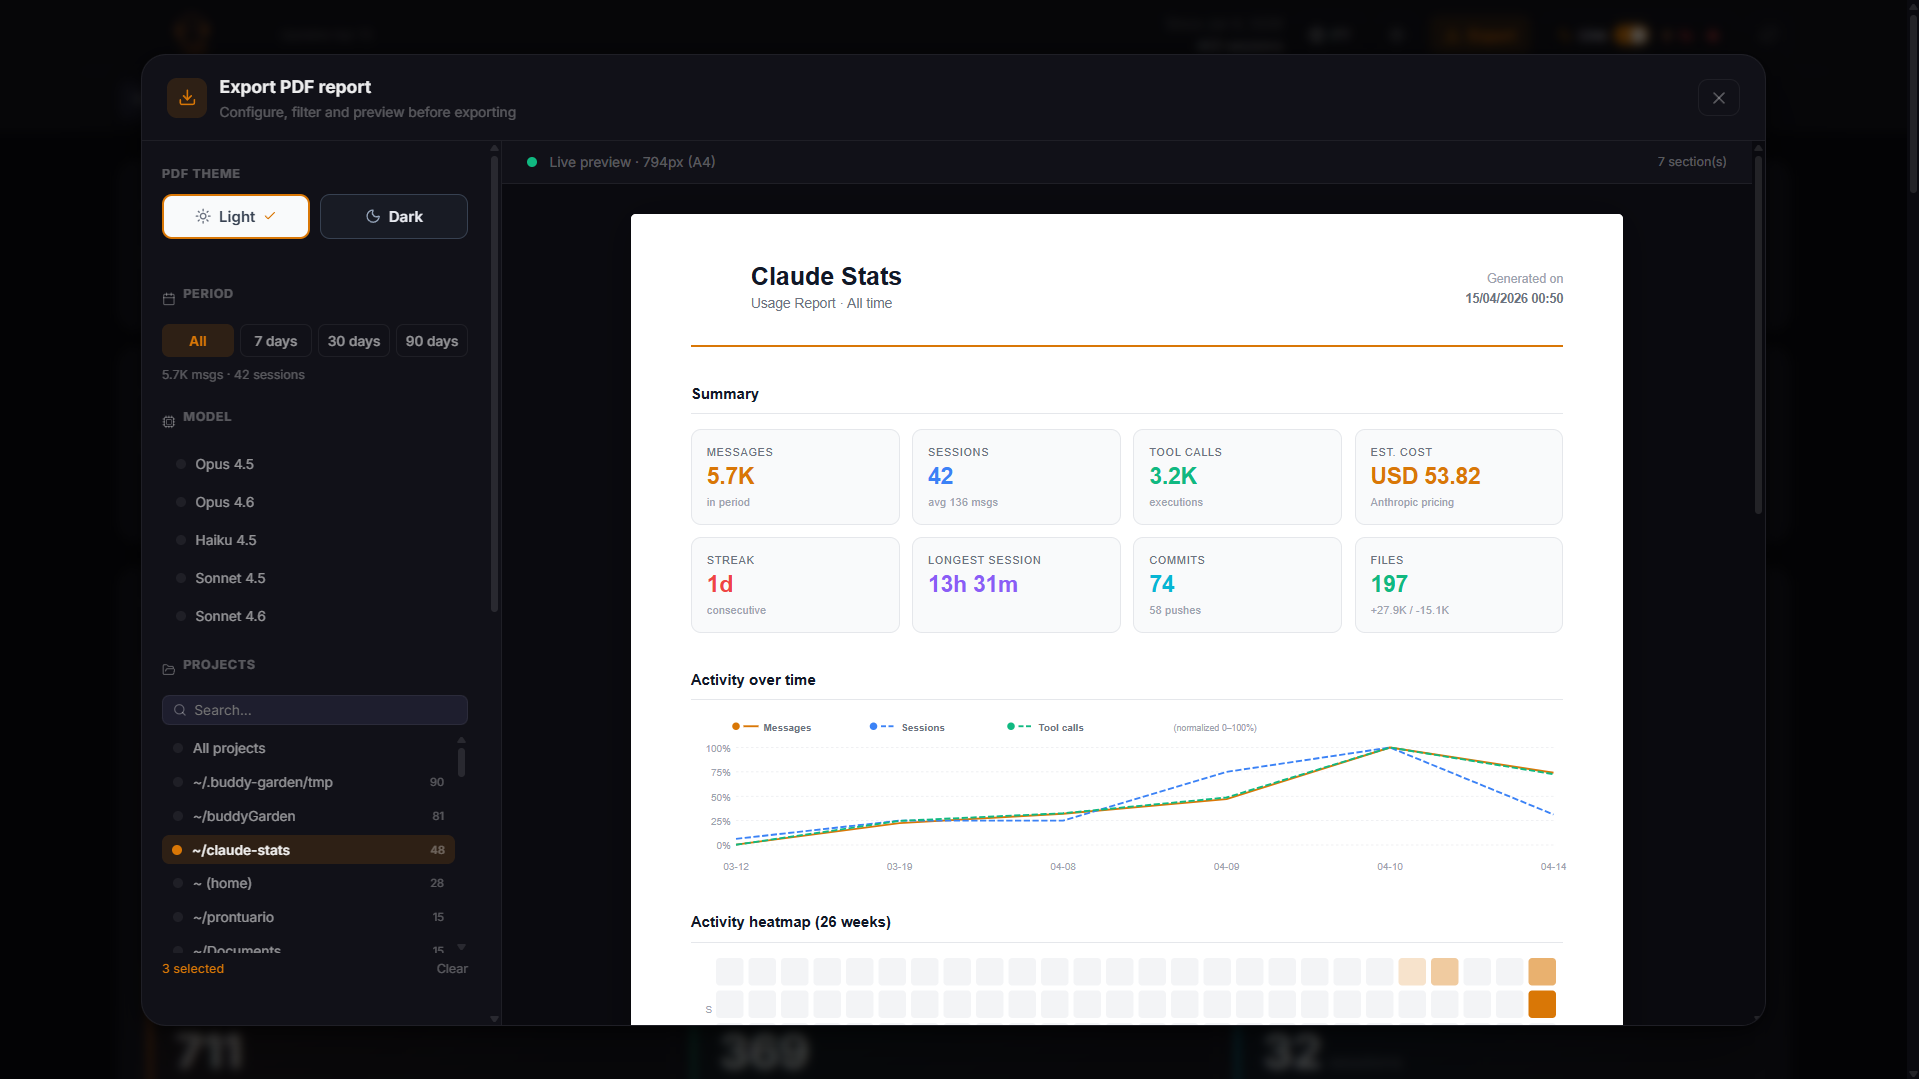
localhost:3001
Dashboard Overview Activity Model Usage Projects & Tools Agent Metrics Recent Sessions

PDF Export

One-click report — dark & light themes, shareable anywhere

PDF Export — dark theme page 1
PDF Export — dark theme page 2
PDF Export — light theme

Ready to see your own data?

Get started on GitHub
$ agentop server

Three commands.
Total observability.

Three commands, three modes — a fullscreen TUI for live metrics, a background OTel daemon, and a server with embedded React dashboard.

$ agentop tui
$ agentop watch
$ agentop server

Everything you need to
understand your AI usage

Input, output, cache read and cache write tokens broken down separately for every session and every model. Understand exactly where your token budget goes and which cache strategies save you the most.

Real costs in USD and BRL with live exchange rates. Blended cost-per-token across your entire model mix. Per-model breakdown with exact Anthropic pricing so you know which model is costing what.

Every Agent tool call is tracked individually: duration, token usage, cost, and detailed tool stats including file reads, edits, bash executions, and searches. Compare success rates per agent type across your sessions.

GitHub-style contribution heatmap of your AI coding activity across 52 weeks. Streak counter that tracks consecutive active days — without penalizing you for not having worked yet today. Intensity reflects token volume per day.

Token and cost distribution across every Claude model in your usage history. Filter by project to identify which workstreams lean most heavily on expensive models. Donut chart and per-model table with share percentages.

Reads directly from ~/.claude/ on your filesystem. No cloud sync, no account creation, no analytics, no telemetry. A single binary that parses JSONL files locally and serves everything from your machine.

Export your AI usage metrics to any OTel-compatible backend. Token counters, cost gauge, session count, streak days, git line stats, and per-tool-type call counts. Works with Prometheus, Grafana, Datadog, and any OTLP endpoint.

One-click export of your full analytics report as a PDF. Includes token usage, cost breakdown, session history, model distribution, and agent metrics. Choose between dark and light themes — perfect for sharing with your team.

Up and running
in 30 seconds

Single binary, no config, no dependencies. Drop it anywhere in your $PATH and start exploring your AI usage immediately.

01

Download the binary

One-line install for Linux/macOS. Or clone and build from source with Bun.

02

Run agentop server

Starts the API on port 3001 and serves the full React dashboard. Your ~/.claude/ is read directly — no config needed.

03

Watch metrics live

Use agentop tui for a fullscreen terminal dashboard or agentop watch to stream OTel metrics to your observability stack.

~/install.sh
# download the latest release
curl -fsSL \
  https://github.com/blpsoares/agentistics/\
releases/latest/download/agentop-linux \
  -o agentop

chmod +x agentop
sudo mv agentop /usr/local/bin/

# start the dashboard
agentop server

# open in browser
  http://localhost:3001

# live TUI (separate terminal)
agentop tui

# OTel metrics export
OTEL_EXPORTER_OTLP_ENDPOINT=\
  http://localhost:4318 \
agentop watch

Data flow from
file to insight

Every session is a JSONL file. Agentistics parses them locally, aggregates stats-cache, extracts agent metrics, and streams live updates via SSE — all without ever touching a remote server.

Start tracking your AI usage today

Open source · Local first · Built with Bun + React + TypeScript

Bun · React · TypeScript · Vite · Three.js · chokidar · OpenTelemetry